


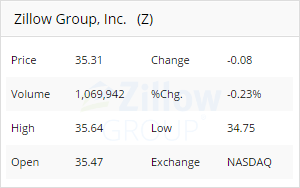
Get company information for a given stock symbol.
Get list of competitors (C) and other companies (R) related to a given stock symbol.
Provides holidays for a given stock exchange that contains a given symbol.
Get list of crypto exchanges supported.
Get list of cryptocurrencies supported.
Get list of cryptocurrency pairs supported by an exchange.
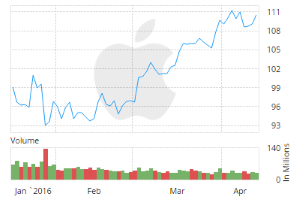
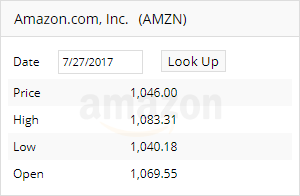
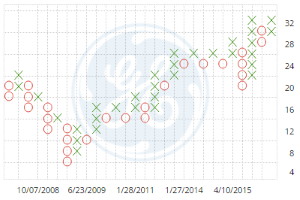
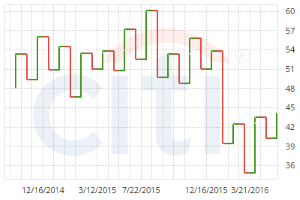
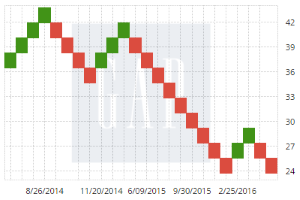
Provides historical prices for a given symbol, between a range of dates.
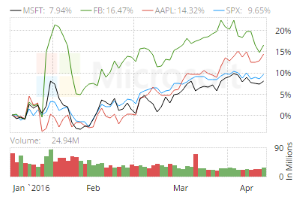
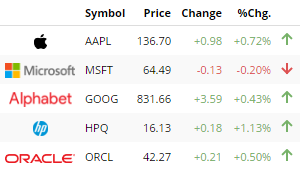
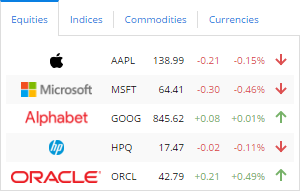
Provides latest prices available for a list of given symbols. Price delay time depends on the symbol's stock exchange.
Obtain the previous close price for a stock symbol on a particular date
Provides a list of stock exchanges available in the service.
Provides a list of exchanges where the given symbol exists.
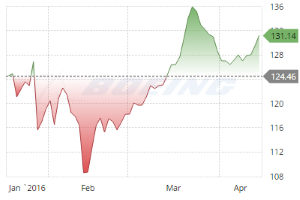
Provides historical prices for a given index, between a range of dates.
Provides the latest price available for a given symbols. Price delay time depends on the symbol's stock exchange.
Provides a list of top gainers (percent) for a given exchange
Provides a list of dividends for a given symbol, between a period of time.
Returns a list of stock exchanges and their latest prices
Provides a list of splits for a given symbol, between a period of time.
Provides historical prices for a given cryptocurrency pair and a given exchange, between a range of dates.
Provides latest prices available for a list of given symbols. Price delay time depends on the symbol's stock exchange.
Provides latest prices available for a list of given symbols. Price delay time depends on the symbol's stock exchange.
Provides latest prices available for most symbols in a given exchange. Price delay time depends on the symbol's stock exchange.
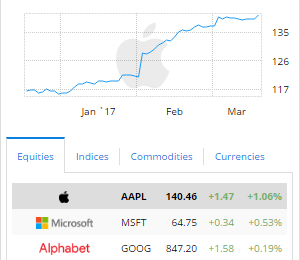
Provides multiple stocks snapshots with the most relevant data for a quick analysis.
Provides access to calculations of one or more technical indicators for a given stock symbol.
A momentum indicator that attempts to gauge supply and demand by determining whether investors are generally "accumulating" (buying) or "distributing" (selling) a certain stock by identifying divergences between stock price and volume flow.
Average true range (ATR) is a technical analysis volatility indicator originally developed by J. Welles Wilder, Jr. for commodities. The indicator does not provide an indication of price trend, simply the degree of price volatility. The average true range is an N-day smoothed moving average (SMMA) of the true range values. Wilder recommended a 14-period smoothing.
Bollinger Bands is a technical analysis tool invented by John Bollinger in the 1980s as well as a term trademarked by him in 2011. Having evolved from the concept of trading bands, Bollinger Bands and the related indicators %b and bandwidth can be used to measure the "highness" or "lowness" of the price relative to previous trades. Bollinger Bands are a volatility indicator similar to the Keltner channel.
Developed by Marc Chaikin, the Chaikin Oscillator measures the momentum of the Accumulation Distribution Line using the MACD formula. This makes it an indicator of an indicator. The Chaikin Oscillator is the difference between the 3-day EMA of the Accumulation Distribution Line and the 10-day EMA of the Accumulation Distribution Line. Like other momentum indicators, this indicator is designed to anticipate directional changes in the Accumulation Distribution Line by measuring the momentum behind the movements. A momentum change is the first step to a trend change. Anticipating trend changes in the Accumulation Distribution Line can help chartists anticipate trend changes in the underlying security. The Chaikin Oscillator generates signals with crosses above/below the zero line or with bullish/bearish divergences.
The CCI is calculated as the difference between the typical price of a commodity and its simple moving average, divided by the mean absolute deviation of the typical price. The index is usually scaled by an inverse factor of 0.015 to provide more readable numbers.
Detrended Price Oscillator (DPO) is an indicator designed to remove trend from price and make it easier to identify cycles
Ease of movement (EMV) is an indicator used in technical analysis to relate an asset's price change to its volume. Ease of Movement was developed by Richard W. Arms, Jr. and highlights the relationship between volume and price changes and is particularly useful for assessing the strength of a trend. High positive values indicate the price is increasing on low volume: strong negative values indicate the price is dropping on low volume. The moving average of the indicator can be added to act as a trigger line, which is similar to other indicators like the MACD.
It can refer to the upper and lower limits within which a government or central bank tries to keep its currency exchange rate. Sometimes known as an intervention band. It can also refer to a term used in technical analysis to describe a band or channel in which prices are confined for a time by support and resistance levels.
Exponential Moving Average (TMA) re-averages a simple moving average to make it even smoother.
MACD Is a trading indicator used in technical analysis of stock prices, created by Gerald Appel in the late 1970s. It is supposed to reveal changes in the strength, direction, momentum, and duration of a trend in a stock's price.
Mass index for a commodity is obtained by calculating its exponential moving average over a 9 day period and the exponential moving average of this average (a "double" average), and summing the ratio of these two over a given amount of days (usually 25).
In statistics and probability theory, the median is the number separating the higher half of a data sample, a population, or a probability distribution, from the lower half. The median of a finite list of numbers can be found by arranging all the observations from lowest value to highest value and picking the middle one (e.g., the median of {3, 3, 5, 9, 11} is 5). If there is an even number of observations, then there is no single middle value; the median is then usually defined to be the mean of the two middle values (the median of {3, 5, 7, 9} is (5 + 7) / 2 = 6), which corresponds to interpreting the median as the fully trimmed mid-range. The median is of central importance in robust statistics, as it is the most resistant statistic, having a breakdown point of 50%: so long as no more than half the data is contaminated, the median will not give an arbitrarily large result. A median is only defined on ordered one-dimensional data, and is independent of any distance metric. A geometric median, on the other hand, is defined in any number of dimensions.
Momentum is the empirically observed tendency for rising asset prices to rise further, and falling prices to keep falling.
The money flow index (MFI) is an oscillator that ranges from 0 to 100. It is used to show the money flow (an approximation of the dollar value of a day's trading) over several days.
A technical indicator that relies on changes in a security’s volume to identify when smart money is driving the current trend. The Negative Volume Index suggests that unsophisticated investors buy and sell primarily on high-volume days, while shrewd investors are more likely to trade on low-volume days. The concept was developed by Paul Dysart in the 1930s and later refined by Norman Fosback.
On-balance volume (OBV) is a technical analysis indicator intended to relate price and volume in the stock market. OBV is based on a cumulative total volume.
Rate of Change (ROC) Is the percentage change in price over a specified time frame
An indicator used in technical analysis that is based on days where trading volume has significantly increased from the previous day. The Positive Volume Index (PVI) assumes that uninformed investors dominate the action on days with substantial trading volume, while the "smart money" - consisting of institutions, funds and professional traders - is more active on relatively quiet days with below-average trading volume.
A technical indicator consisting of a cumulative volume line that adds or subtracts a multiple of the percentage change in share price trend and current volume, depending upon their upward or downward movements.
The speed at which a variable changes over a specific period of time. Rate of change is often used when speaking about momentum, and it can generally be expressed as a ratio between a change in one variable relative to a corresponding change in another. Graphically, the rate of change is represented by the slope of a line.
Relative Strength Index (RSI) is a technical momentum indicator that compares the magnitude of recent gains to recent losses in an attempt to determine overbought and oversold conditions of an asset.
In financial applications a simple moving average (SMA) is the unweighted mean of the previous n data. However, in science and engineering the mean is normally taken from an equal number of data on either side of a central value. This ensures that variations in the mean are aligned with the variations in the data rather than being shifted in time. An example of a simple equally weighted running mean for a n-day sample of closing price is the mean of the previous n days' closing prices.
Standard Deviation is a measure that is used to quantify the amount of variation or dispersion of a set of data values. A standard deviation close to 0 indicates that the data points tend to be very close to the mean (also called the expected value) of the set, while a high standard deviation indicates that the data points are spread out over a wider range of values.
The stochastic oscillator is a momentum indicator that uses support and resistance levels. Dr. George Lane developed this indicator in the late 1950s. The term stochastic refers to the point of a current price in relation to its price range over a period of time. This method attempts to predict price turning points by comparing the closing price of a security to its price range.
Triangular Moving Average (TMA) re-averages a simple moving average to make it even smoother.
Triple Exponential Average (TRIX) is a momentum indicator showing the percentage change in a triple exponentially smoothed moving average
The typical price is the average of the high, low, and closing prices for each period.
Chalkin Volatility was developed by Marc Chaikin. It is a volatility indicator which calculates the Exponential Moving Average of the difference between the current interval’s high and low prices and its value a number of periods previously. A sudden increase indicates a directional move and over time the current and historical Exponential Moving Average tend to align which results in the Chaikin Volatility indicator tending towards zero.
An oscillator is a technical analysis indicator that varies over time within a band (above and below a center line, or between set levels). Oscillators are used to discover short-term overbought or oversold conditions.
The Weighted Close indicator is an average of each day’s price. Twice as much weight is given to the closing price as is given to the sum of the daily high and daily low. The Median Price and Typical Price are similar indicators.
A weighted average is any average that has multiplying factors to give different weights to data at different positions in the sample window. Mathematically, the moving average is the convolution of the datum points with a fixed weighting function. One application is removing pixelisation from a digital graphical image.
Williams %R, or just %R, is a technical analysis oscillator showing the current closing price in relation to the high and low of the past N days (for a given N). It was developed by a publisher and promoter of trading materials, Larry Williams. Its purpose is to tell whether a stock or commodity market is trading near the high or the low, or somewhere in between, of its recent trading range.